
06.19.2025 Evidentia Group
Market Moves and Performance
- Last week saw markets sold off. The S&P 500 (-5%), NASDAQ (-5.6%), Euro STOXX 50 (-4.9%), ASX200 (-4.3%) were all weaker.
- This extends the sell off that has already occurred this year. Year-to-date the S&P 500 (-17.6%), NASDAQ (-27.3%) Euro STOXX 50 (-18.5%), ASX (-5.5%) have all traded lower.
- The significant shift in interest rate expectations has also seen fixed interest categories post negative returns.
- Our portfolios have been far more resilient than the worst hit global markets but are understandably still down year-to-date.
- Asset class returns to the end of May are shown in the table below.
| Trailing Returns | Period ended 31/5/22 1 mth |
3 mths | 12 mths | 3 yrs (p.a.) | 5 yrs (p.a.) | 10 yrs (p.a.) |
| Australian Shares | -2.8 | 3.1 | 4.7 | 8.0 | 9.0 | 10.3 |
| Australian Small Caps | -7.0 | -3.6 | -4.6 | 5.5 | 8.5 | 6.3 |
| Global Shares - All Country (Local) | -0.2 | -4.4 | -3.2 | 12.2 | 9.5 | 11.4 |
| Global Shares - All Country (Unhedged) | -0.8 | -4.8 | 0.6 | 10.4 | 9.8 | 13.6 |
| US Shares (USD) | 0.2 | -5.2 | -0.3 | 16.4 | 13.4 | 14.4 |
| Europe Shares (EUR) | 0.9 | -1.7 | -3.8 | 7.2 | 3.7 | 8.8 |
| Emerging Mkts Shares (Local) | -0.2 | -5.7 | -15.7 | 6.5 | 5.7 | 6.7 |
| Global Property (Hedged) | -4.6 | -4.1 | -1.2 | 1.7 | 3.7 | 8.0 |
| Austrlaian Property | -8.7 | -7.1 | 3.3 | 2.2 | 5.7 | 10.8 |
| Global Infrastructure (Hedged) | 1.8 | 6.4 | 10.7 | 6.6 | 6.8 | 10.8 |
| Australian Fixed Interest Composite | -0.9 | -6.0 | -8.5 | -1.8 | 1.0 | 2.7 |
| Global Fixed Interest Composite (Hedged) | -0.2 | -5.1 | -7.4 | -0.7 | 1.1 | 3.3 |
| Cash - Bank Bills | 0.0 | 0.0 | 0.0 | 0.4 | 1.0 | 1.8 |
| Evitentia 70 Growth SAA Benchmark | -1.3 | -1.6 | 0.5 | 6.0 | 6.6 | 9.0 |
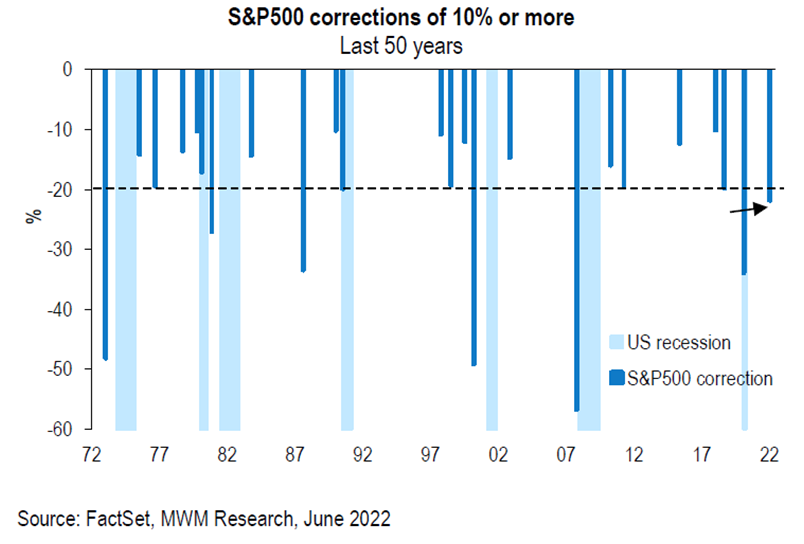
To give you more context on this correction, the below table shows that the US market is now officially in a “bear market”, meaning more than 20% off its most recent highs. Relative to history, the current market draw down is already larger than the average correction. Whilst this may indicate that a large portion of the potential decline is now behind us, there have been corrections of a larger magnitude. These larger declines have more typically been associated with recessionary environments, which remains a risk (but not our current base case).
What is causing the sell-off? Market themes
- Higher-than-expected US inflation data last Friday have helped push equity markets down as financial markets increasingly fears high interest rates will lead the economy into recession.
- The US Fed met this week (Wednesday night),and agreed on a 75bp hike. The rationale is they need to “get in front of the curve” and restore confidence that inflation will be subdued.
- So ironically it’s the strength of the economy and corporate profits coupled with exogenous supply shocks (energy prices due to Russia) that is causing central banks to lift interest rates.
Philip Lowe stated this on the ABC on Monday night:
“What we've said right through the last two years was, and this is important, if the economy evolved as we expected, interest rates were unlikely to increase until 2024. So, for most of the past two years, we thought that growth would be slow to recover, that inflation would stay fairly low, that there'd be a long tail from the pandemic and given that, we thought interest rates would need to stay where they were until 2024…….But the economy didn't evolve as we expected. It's been much more resilient, and inflation has been higher, and we thought we needed to respond to that."
What do the experts think on this?
The below quote from Blackrock is a great summary of our view.
“We see central banks ultimately opting to live with inflation instead of raising policy rates to a level that destroys growth. That means inflation will likely stay higher than pre-covid levels. We also think the Fed will quickly raise rates and then hold off to see the impact. The question is when this dovish pivot will take place. This uncertainty is why we’re tactically neutral on stocks but overweight on a strategic, or longer-term, horizon. We think the sum total of rate hikes will be historically low.”
What are we doing in portfolios?
- Earlier in the year we took a more defensive stance in portfolios reducing our weighting to equities and reducing our exposures to credit.
- As we stand, we are maintaining our cautious approach while on the look-out for sign-posts of opportunity to buy into a weaker equity market.
- We haven’t increased our allocation to shares yet from their broadly neutral position. There are a number of key sign posts we are looking to before we do this with the main one being more certainty around how far central banks will raise rates in the face of softening economic conditions. At this stage it is difficult to predict when that will be. What we do know is that when equity markets turn, they have typically delivered very strong returns (>40%) in the year from the bottom.
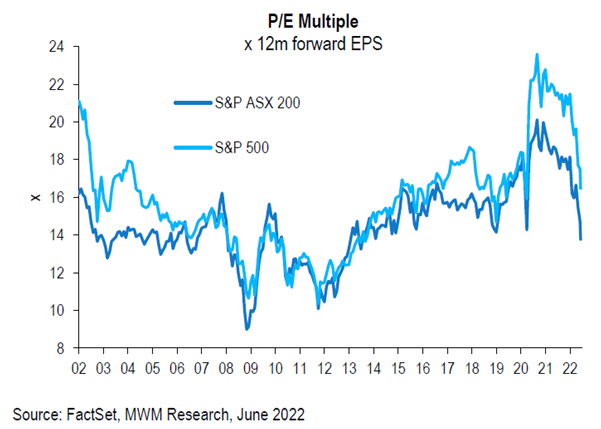
- The positive news is that valuations (both in Australian and internationally) have improved. This is both due to robust earnings growth for corporates (improved earnings means a lower valuation multiple for shares) and to lower share prices due to the recent sell off.
- We have also been increasing the duration of our fixed interest assets (bonds). Increasing duration means buying longer dated bonds. Longer dated bonds:
- Have higher yields, aiding expected returns;
- Will provide capital gains if interest rate expectations come down (if interest rates don’t rise as much as what is priced in). For clients wanting to know what is currently priced in refer to the table on page 7 of the Evidentia Monthly commentary.
Key messages
Stay focused
As you know, all of our clients have a structured investment plan that is specifically crafted for your situation and takes into account your timeframe, risk profile, goals and objectives. Nothing in these markets causes us to re-think the foundations of our advice but we thought we would recap a few relevant messages for investors.
Message 1: Take a long term perspective
Take a long term perspective and trust that over the long term markets work. A famous quote from Warren Buffet is, “in the short run, the market is a voting machine but in the long run it is a weighing machine.” What Warren Buffet means by this is that in the short-term, market prices are determined by buying and selling often reacting to and reflecting short term issues and news flow (such as rising interest rates, wars, pandemics etc). However, over the long run asset prices are determined by the quality of the asset to produce returns and income for the asset owners. The chart below is part of our investment philosophy of “investing differently."
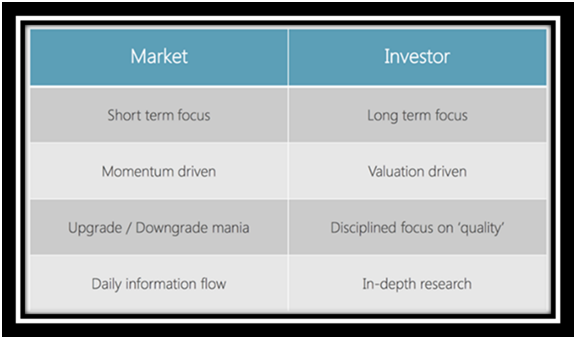
We are investors rather than speculators. Research shows that making investment decisions based on fundamental analysis and empirical evidence rather than short term noise delivers better long-term investment outcomes.
Message 2: Markets Work
The table below shows the annual returns for Australian shares over the past 120 years sorted by total return.
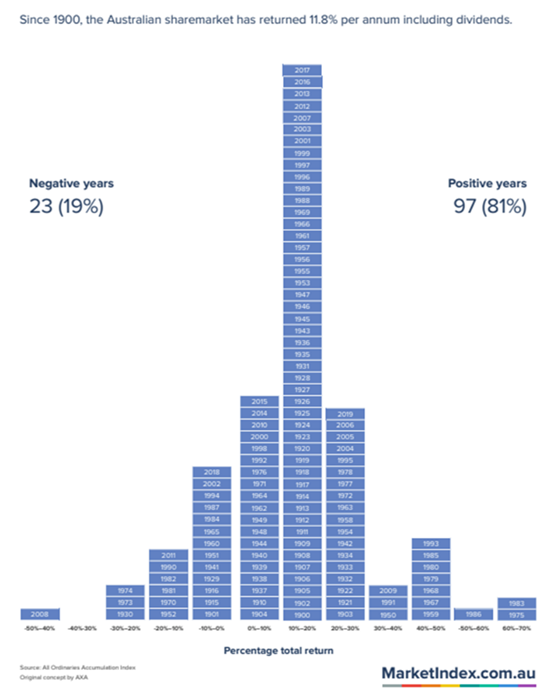
There are a number of key takeaways from this table:
- While there are negative years the overwhelming majority of yearly returns 81% are positive (it doesn’t pay to bet against the market over time);
- The most common return is for 10-20% but there is a lot of movement around this median (markets don’t go up in straight lines);
- Average annual returns have been 11.8%pa (and have outpaced inflation maintaining purchasing power of your wealth);
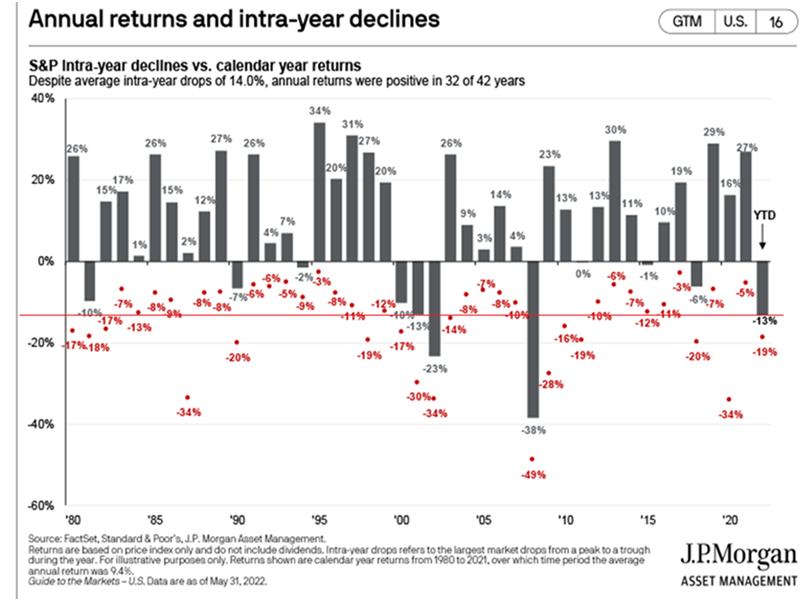
Message 3: Markets don’t go up in straight lines
The table below shows that volatility is even more prevalent over even shorter timeframes. An investor that buys and holds the S&P 500 index in the US has historically received the calendar year returns indicated by the grey bars. However, the red dots illustrate the largest intra year drawdown in each of these periods.
The key takeaway should be that intra year drawdowns are very common and this is a natural part of investing in shares. They also do not preclude a positive return for that year. Investors should not react to market drawdowns and crystalise the intra year losses, but instead buy and hold the asset and experience the returns shown with the grey bars.
Message 4: Diversification works
In any market environment, we strongly believe that investors should stay diversified across a variety of asset classes and not try to time or outsmart markets in the short term. Looking at the current YTD returns across a variety of indices and asset classes, it is apparent that many individual asset classes have sold off far more aggressively than our diversified portfolios.
This diversification is important for portfolio resiliency across all market conditions, so we would caution against reducing diversification by chasing the top performing asset class (this current YTD it is cash).
Asset Class |
Index |
YTD (to 14thJune) |
|
Australian Shares |
S&P/ASX 300 Total Return Index |
-5.5% |
|
|
S&P/ASX 200 Equal Weight Net Total Return Index |
-14.5% |
|
|
S&P ASX 200 Total Return Index |
-5.1% |
|
International Shares |
MSCI ACWI AUD NETR |
-16.2% |
|
|
MSCI World Ex Australia Hedged AUD Net Total Return Index |
-19.5% |
|
|
FTSE EPRA Nareit Developed hedged in AUD Net TRI |
-19.9% |
|
Infrastructure |
FTSE Global Core Infrastructure 50/50 100% Hedged to AUD Net Tax Index |
-3.2% |
|
Australian Fixed Interest |
Bloomberg AusBond Composite 0+ Yr Index |
-9.5% |
|
International Fixed Interest |
Bloomberg Global-Aggregate Total Return Index Value Hedged AUD |
-9.5% |
|
Specific Equity Markets |
S&P 500 Total Return Index |
-20.8% |
|
|
S&P 500 Value Total Return Index |
-11.3% |
|
|
S&P 500 Growth Total Return Index |
-29.3% |
|
|
Russell 2000 Total Return Index |
-23.2% |
|
|
EURO STOXX 50 Net Return EUR |
-16.9% |
|
Specific Equity market Sectors |
MSCI World Financials Local |
-15.7% |
|
|
MSCI World Energy Sector Local |
42.0% |
|
|
MSCI World Materials Sector Local |
-7.6% |
|
|
MSCI World Industrials Local |
-17.5% |
|
|
MSCI World Consumer Discretionary Local |
-30.2% |
|
|
MSCI World Consumer Staples Local |
-9.5% |
|
|
MSCI World Health Care Local |
-12.7% |
|
|
MSCI World Communication Services Sector Local |
-27.6% |
|
|
MSCI World Utilities Sector Local |
-5.7% |
|
|
MSCI World Real Estate Local |
-20.8% |
|
|
MSCI World Information Technology Local |
-30.0% |
|
|
MSCI World Net Total Return Local Index |
-18.3% |
At Wealth Management Partners we are here to support you. If you do have concerns about your portfolio, please get in touch with your adviser.
This article was written and accurate as of 16 June 2022.